

Viewing Quiz Results / Student Assessments

When using Kids ONLINE Mode, there are several tools available for teachers to assess student performance. These can be further broken down to class assessment and individual student assessment.
Class/Team Assessment
Leaderboards
The easiest way to quickly see how your team is doing is by looking at various team-based leaderboards. For more information on leaderboards, please refer to the user guide on Leaderboards.
Viewing team quiz results
You can see the results of each quiz at the team level (e.g. how many students chose what answer) through the lesson dashboard itself.
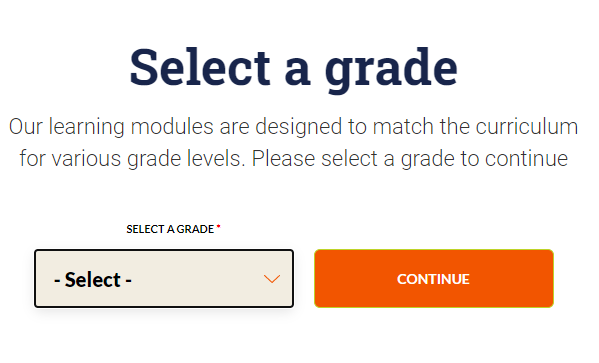
First, go to Lessons and, if the modules proposed are not for the proper grade, click on Change grade. Select your grade level and click on CONTINUE.
Select a learning module. Then, click on View Scores beneath a lesson name to confirm if any of your students have finished any quizzes for this learning module.
Once you click on View Scores, you will see a list of students who have taken that quiz and their results.
On this page, you will see a grid with the following:
- Results for XYZ Team (the name of your team)
- The name of the quiz you’re looking at
- The questions in the default order that the students take them
Under each question, you’ll see several columns:
- Correct? - The answer with * is the correct one
- Answer - Shows all the possible answer options
- # of responses - Shows the number of students in this team that chose this answer
- % of responses - Shows the percentage of students on this team that chose this answer
There are several ways teachers have used this information. Here are a few examples:
- To quickly assess which questions and topics students are excelling at or struggling with.
- To see if most students have answered quiz questions in a specific lesson. If the number of responses does not add up to the number of students on your team, it means not everyone has taken the quiz.
- To use as part of a pretest activity or review. If you are showing the lessons in front of the class, you can show this to the class as well to get and give a sense of where the class is without singling out any individual student’s answers. It also enables you, the teacher, to address any specific quiz questions that may have been difficult.
Individual student assessment
There are several ways to see how individual students have performed on quizzes.
Leaderboards
One easy way to see student performance is to refer to the leaderboards and look at the number of vaccines a student has earned. For more information on how students earn vaccines, you can refer to the user guide on Types of Quizzes. For more information on all the different leaderboards, you can refer to the user guide on Leaderboards.
Another way to do so is to look at student scores. There are two types: aggregated and detailed student scores.
Aggregated student scores
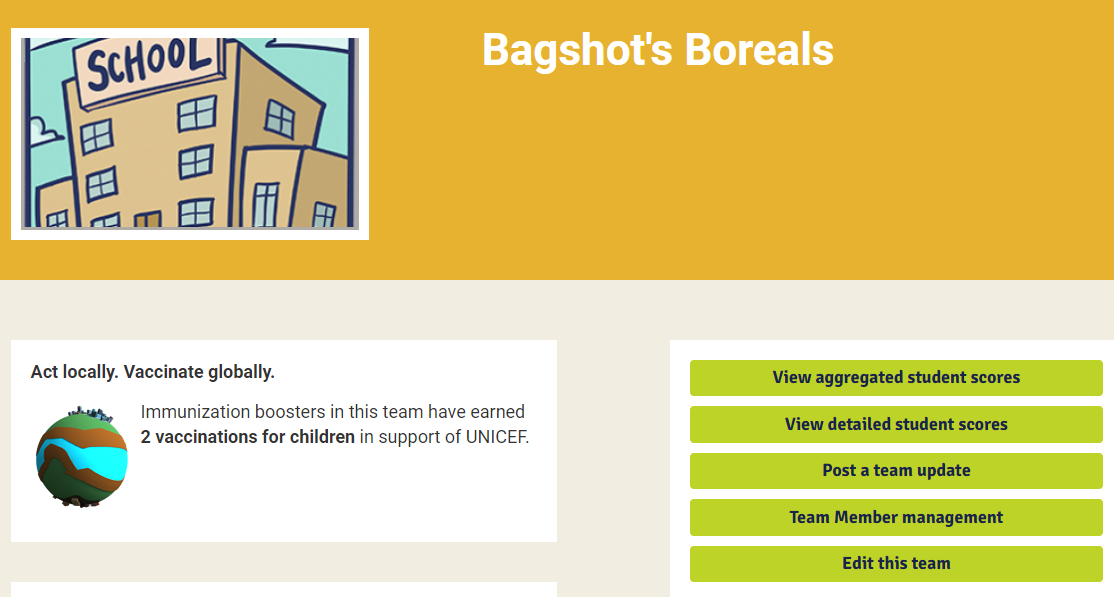
Go to your Team page and click on the team name.
You have a number of options to choose from on the right-hand side. The first option is called View aggregated student scores.
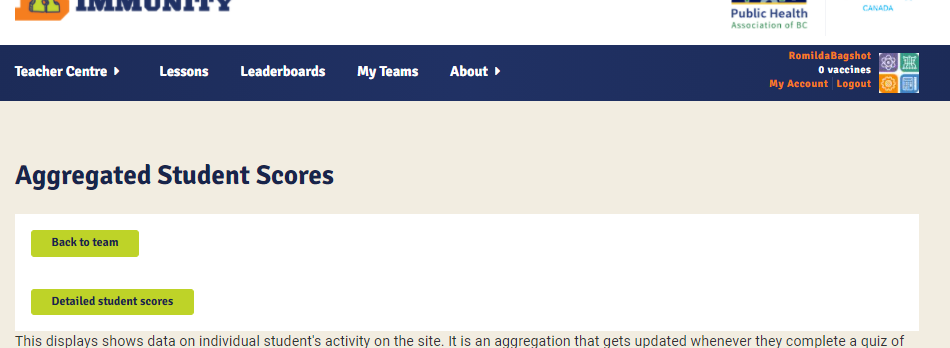
Click on View aggregated student scores. You can also get there by pressing the Aggregated Scores button on the Detailed Student Scores page.
The aggregated student scores show the average score for each student across all the quizzes they have taken. This means that if a student takes the same quiz twice, the two attempts are counted as if they are two distinct quizzes and are averaged out instead of updating the previous score on the same quiz.
This is a great way to quickly see how specific students are performing on average. However, there are crucial limitations to consider. Our data shows that most students retake quizzes over and over in order to increase their scores. Since the score shown on this page averages out all the attempts on any quiz, students who are persistent and slowly increase their score might have a higher best score but a lower average score than a student who passes the quiz and moves on after their first try. For example:
Student A takes the same quiz three times and scores: 25%, 50%, and 100%.
Student B takes the quiz once, scores 80%, and earns a vaccine.
On the Aggregated student scores page, Student A would have a score of 58%. Student B would have a score of 80%. Yet, Student A’s best score is 100%.
For more detailed information on a student's scores, you can refer to the detailed student scores.
The Aggregated student scores page also shows the number of vaccines any single student has earned. This is particularly useful if you have turned off the leaderboards on your team page.
Detailed Student Scores
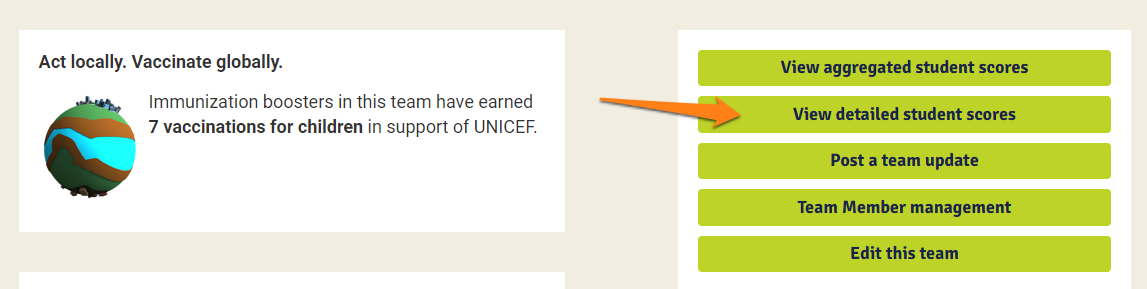
If you are on the Aggregated student scores page, you can click on the Detailed student scores button to get to detailed student scores. Alternatively, go to your Team page. There, scroll down to the options menu on the right. The second option is called View detailed student scores.
This will take you to the Detailed Student Scores page, which looks like this:
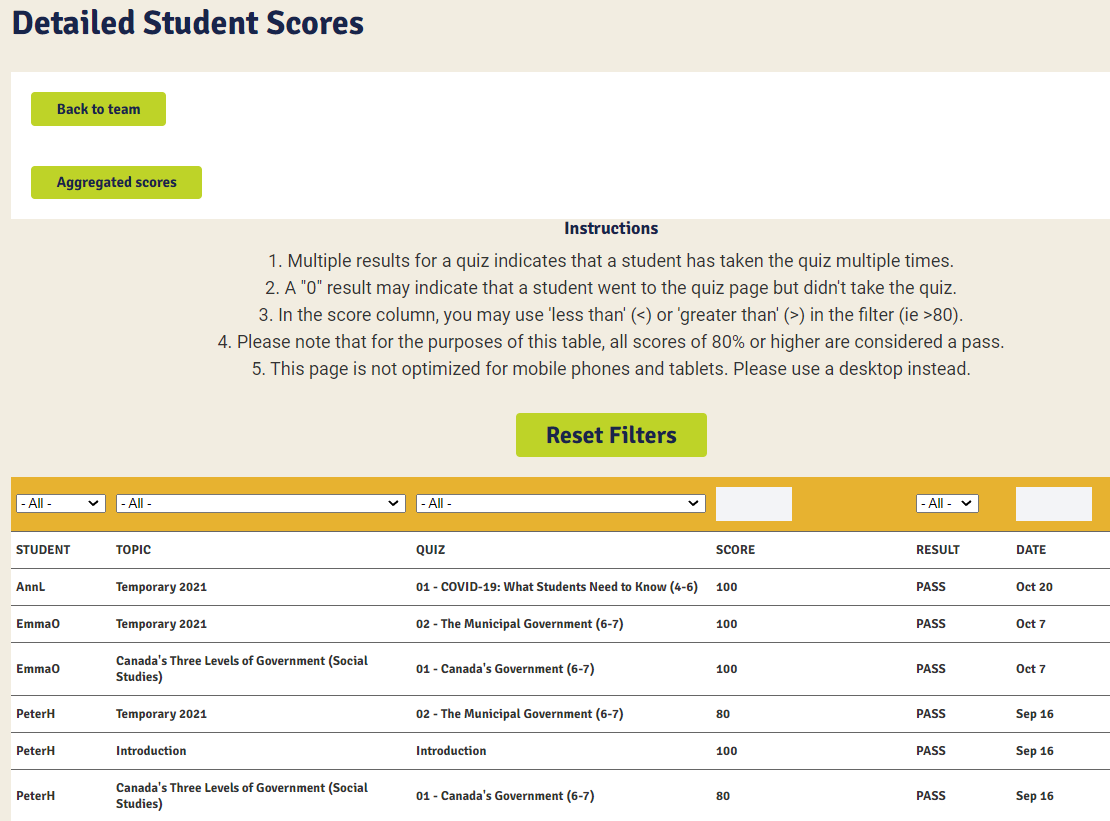
The detailed student scores gives teachers access to every quiz result for every student, including retakes. There are six columns by which teachers can sort the data.
- STUDENT - This is the login name of the student. It should be a combination of their first name and last initial. If you are unsure of any names, you can ask your students.
- TOPIC - This is the topic of the quiz
- QUIZ - This is the specific quiz
- SCORE - This is the score that the student scored on that quiz for that specific attempt. A score of 0 may indicate that a student went to the quiz page but didn’t take the quiz.
- RESULT - Pass or fail, with the pass being over 80% for that specific attempt.
- DATE - the date that the quiz was taken.
Each column also has filters which you can use to sort the data, as can be seen here:
![]()
Please note that the filters compound with all other filters. If you have selected any filters, the other filters will only enable options that fit within previously selected filters. For example, if you have selected a specific student, your filter options in TOPIC and QUIZ will be limited by the topics and quizzes that that specific student has actually completed. Another example: if you have selected a topic under the TOPIC filter, then the quiz filter will only show quizzes within that chosen topic.
Press the Reset Filters button to reset all filters to start from the beginning.
- STUDENT - You can filter by a specific student if you want to see all the quizzes they’ve done.
- TOPIC - You can filter by specific topic or all topics.
- QUIZ - You can filter by specific quiz or all quizzes
- SCORE - You can filter by a specific score. Entering 80 will show results that only equal 80. You can also enter < or > symbols to use “less than” or “greater than”. Please note that since this is a database with all attempts, filtering by “less than 50” will show people who have scored less than 50 at any attempt. In other words, even if a student eventually scored 100 on subsequent attempts, if they scored less than 50 at any point, that attempt will show up. If you want to know the students who have scored higher than 50 at any point, the “greater than” function is more accurate.
- RESULT - You can filter by PASS or FAIL, with 80 and above counts as a pass.
- DATE - You can look for a specific date. This is useful to see if students completed lessons on specific days.
These filters can be useful in many ways. You can also copy and paste these into your preferred spreadsheet by simply highlighting the info and pasting it. It's particularly useful in tracking individual students' progress - you can see if a student is attempting a quiz multiple times to raise their scores, for example.
A few additional notes on the detailed student scores:
- Multiple results for a quiz indicates that a student has taken the quiz multiple times.
- A "0" result may indicate that a student went to the quiz page but didn't take the quiz.
- In the score column, you may use 'less than' (<) or 'greater than' (>) in the filter (ie >80).
- Please note that for the purposes of this table, all scores of 80% or higher are considered a pass.
- This page is not optimized for mobile phones and tablets. Please use a desktop or laptop computer instead.
Assessing student performance for classes using a mix of Kids ONLINE Mode and Kids OFFLINE Mode
After a lesson and quiz are completed as a class (Kids OFFLINE Mode), if devices are available, teachers can instruct students to retake the quiz on their individual accounts. This reinforces their learning, and teachers can see the students’ individual quiz scores.

Questions? Leave a comment below!
0 questions answered and 0 vaccines earned worldwide in support of UNICEF this school year.
6,999,968 questions answered and 568,119 vaccines earned worldwide for children in support of UNICEF since March 2018.
(Updated every few minutes.)
Thank you for acting locally to help immunize globally.
You are helping people around the globe get immunity to diseases like polio, tetanus and measles that can be prevented or even eliminated through vaccination! Thank you for all the great work!